
Using this barometer, it may be possible to achieve a level of performance only available in products costing ten times as much, but it will take some work. If money is not an issue, then just go get a Vaisala barometer and be done with it. If money is more important and you still want the performance or you just like science projects, then read on...
The WeatherJack is a diamond in the rough. Out of the box, it is overly sensitive to battery voltage and temperature. On top of this, the RS232 communications port can be flaky and occasionally goes out to lunch, necessitating a power reset on the unit (this may not be the fault of WeatherJack, however). Solutions to these issues have been worked out, and the final result is actually quite impressive. In addition to the barometer, a custom power supply/controller is required which can be built for about $40 in parts (if you build six of them and share the total cost with some friends). The design is now available for download, including schematics, PC board CAD files and a parts list including DigiKey part numbers. Follow the download link above and look in the Documentation section under one of the 2.9 releases. Warning: some assembly required!
It appears the WeatherJack barometer is capable of providing warnings about approaching severe weather. Heavy rain, wind shear and the like are often preceeded by very fast pressure increases or "jumps" (for example 0.03 inHg in just a couple of minutes). The pressure jump is associated with low-level outflow from a convective weather event (aka thunderstorm). The outflow immediately preceeds the severe weather. In the past, simple binary pressure jump detectors have been installed around airports to provide advance warning of wind shear.
Although the advance warning time is short (on the order of a minute or two), it may still of interest to some folks. It should be possible to integrate this capability with the new "Plug-In" feature planned for the next release. Perhaps the pressure jump alarm could be used to play a "WAV" file or something like that.
The temperature sensitivity was re-checked after a couple of months. The coefficient from the first test was 0.147mb/degC and the second test came up with 0.140mb/degC. The change is negligible and is possibly due to different atmospheric pressure trends being superimposed on the test. So far so good.
After about 5 months, it appears there may be a slow drift in the absolute calibration offset. The calibration offset needed to be changed by 0.05 inHg. The power supply voltage was rechecked, and it has not changed significantly. With quality control inputs from CWOP and local airport readings, this amount of drift is manageable.
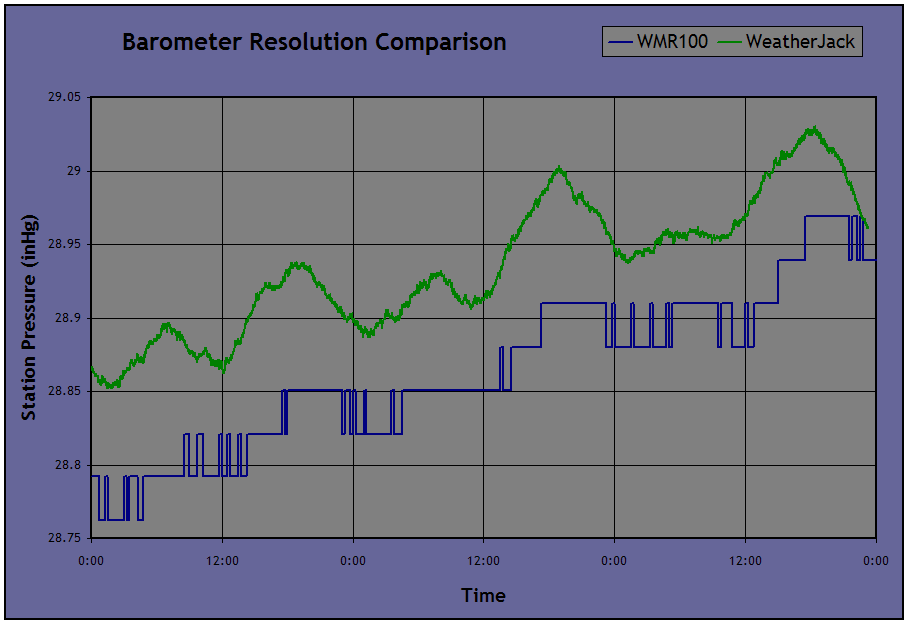
To get an idea of the improvement that is possible, consider the following graph. The blue line shows the data from my WMR100 barometer over a three day period. The WMR100's low resolution is readily apparent here as a "staircase" effect. The green line contains data from the WeatherJack barometer over a (different) 3-day period, 27 days later. The increase in resolution is dramatic, to say the least! Although diurnal pressure variations are hinted at in the WMR100 data, WeatherJack clearly shows what is going on. After careful temperature correction and offset adjustment, analysis of this data via CWOP/MADIS suggests (but does not prove) that it may be accurate to within 0.01 inHg or better.
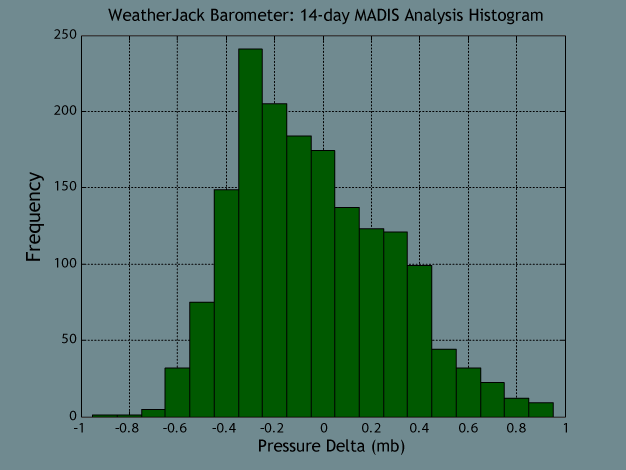
The next figure is a histogram showing the difference between WeatherJack readings and the MADIS analysis over a 14-day period. The Y-axis shows a count of the number of barometer readings that fell within a given range of differences on the X-axis. Over this 14-day period the average difference between WeatherJack and the MADIS analysis was -0.04mb and the standard deviation was 0.32mb.
RS232 communications between WeatherJack and WSDL are not entirely reliable. Occasionally the unit will stop responding to communications. This occurs at random intervals, usually a few hours to a couple of days. The cause is not known and the manufacturer was contacted for assistance. They claim that no one else has seen this problem so it is possibly a problem in the WSDL software. It is not likely a PC hardware problem since I have experienced the lock-ups on three different sets of serial port hardware. At any rate, the effort required to determine if the problem is in the WeatherJack barometer or in WSDL software is significant. Therefore, I am taking the path of least resistance instead, which is outlined below.
A shutdown feature has been added to the regulated power supply, which is controlled by one of the RS232 handshake lines from the computer. This will allow the software to "reboot" the barometer whenever it locks up, and should make the overall system quite reliable. This has been tested now and is working with the prototype.
Tests have shown that the barometer is sensitive to battery voltage, perhaps as much as a millibar per volt at the outside (the coefficient is negative). At the very least, WeatherJack should be powered with a photo-lithium 9V battery (Eveready L522FP). This type of battery will hold a more constant voltage during the discharge cycle. Even so, the barometer readings will tend to slowly creep up from month to month as the battery discharges. The only problem is that this battery has been discontinued by Eveready.
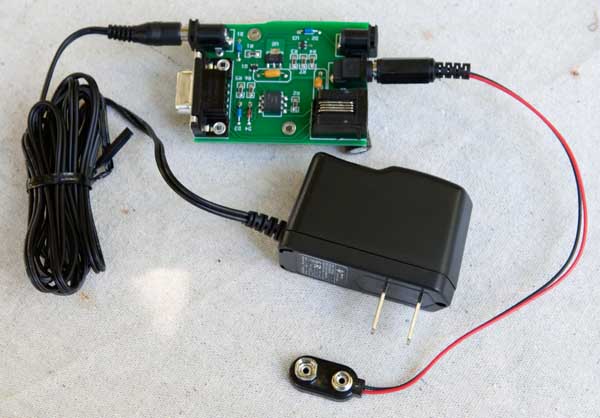
A precision regulated power supply will reduce supply-related variations to a negligible level. An inexpensive prototype regulator has been built which plugs into 120 volt AC power with an optional 12-volt lantern battery for backup. The first photo below shows the supply/controller along with the wall-wart power source and the power output connected to a battery clip.
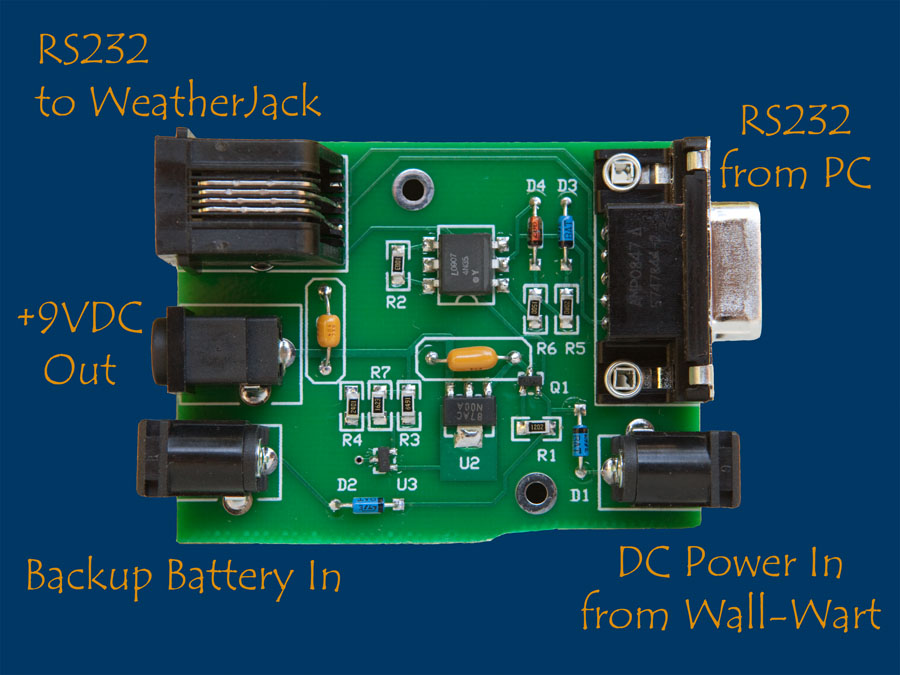
Here's a close-up of the PC board in the next photo. All those surface mount parts were hand-soldered. The tiny SOT-23 packages were a bit challenging, but everything else was pretty easy.
WeatherJack also has significant temperature sensitivity. The temperature coefficient of the unit I tested is negative and may (or may not) be a function of battery voltage. This is all the more reason to use a precision regulated supply instead of a battery as the main source of power. My barometer had a measured temperature coefficient of about -0.15mb/degC.
The graph below shows what happens to the pressure readings when temperature changes. The barometer was already powered with a stable supply at this point. For these tests, there is one point plotted every minute and each point is the average of six readings taken ten seconds apart.
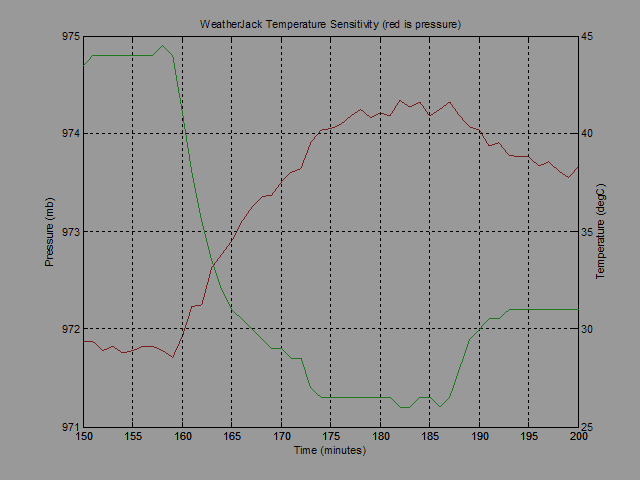
The big drop in temperature from about 44 to 28 degC caused the pressure reading to change by more than 2mb (or 0.06 inHg) between the 155 and 180 minute points on the x-axis. Not good! On the plus side, further experiments suggest the temperature sensitivity is linear.
Luckily the unit comes with a temperature sensor, so most of this sensitivity can be removed in software. However, it will require users to measure their unit's temperature coefficient -- it would not be safe at this point to assume that the sensitivity I measured would apply to all units. It will also be a very good idea to periodically re-check the temperature sensitivity (once a year, perhaps) in case it changes as the WeatherJack's internal components age. I will be re-checking mine every month or two until I feel it is going to be stable.
Using the WeatherJack's built-in thermometer, and after carefully measuring and tweaking in a linear temperature correction, the result below was obtained.
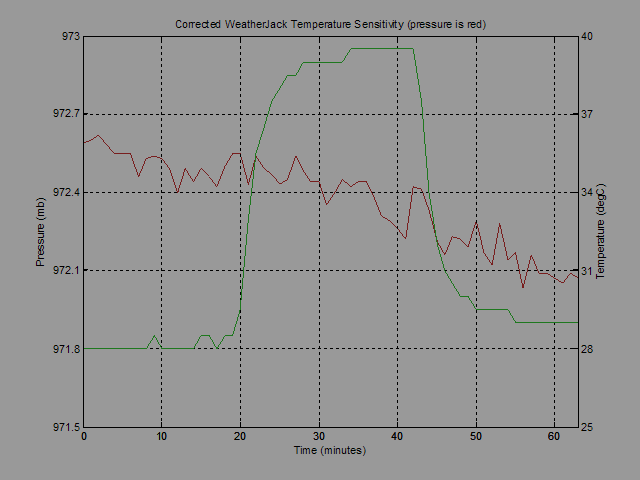
Notice the change in pressure scale -- each vertical grid line is only 0.3mb (or about 0.01 inHg). Even on this expanded scale, there is no noticeable effect from the temperature changes. One of the difficulties with this technique is that external, atmospheric pressure changes are also occuring during the test. It appears that a slight drop in pressure was occuring in this case and is superimposed on top of any temperature-induced changes that might be there.
For normal use, the barometer can be placed in a small wooden box (not air-tight, of course) to help keep any temperature variations slow. Problems can occur during fast temperature changes if the temperature sensor does not ramp at the same rate as the barometer. The photo below shows the barometer and precision 9V power supply/controller sitting in a wood box with cover removed. A USB-to-RS232 converter can be seen plugged into one end of the supply with the RJ11 phone cable on the other end, connected to WeatherJack's RS232 port. The temperature sensor has been taped into the WeatherJack's battery cavity. The loose-fitting wood cover has been removed for this photo. The idea here is to minimize the difference between temperature readings and the barometer's internal temperature.

Finally, it took some trial and error to come up with an effective method to characterize the barometer's temperature behavior using inexpensive, readily available equipment. Details are available in the WeatherJack project download on SourceForge. Click on the "view all files" link, then look under "Documentation" for the 2.9.5.1 release.
The next version of WSDL (2.9.5.1 Beta and later) offers support for the WeatherJack barometer.
It has the ability
to compensate for temperature in addition to a basic calibration offset. People interested in this
feature would find it very helpful to get connected with CWOP -- they offer great data analysis
tools that you can use to get the adjustments tweaked in.
